

Measurement Data Network System MeasurLink
- MeasurLink is a data management modular software system that enables collecting data from a wide range of Mitutoyo measuring tools and systems including Coordinate Measuring Machines.
- Measurement data storage can be centralized by implementing a network system using a company LAN. Quality information such as checking, monitoring, analysis of the measurement results and creating inspection reports can be shared among separate offices to maximize efficiency.
Is the inspection record data utilized to solve quality-related problems?
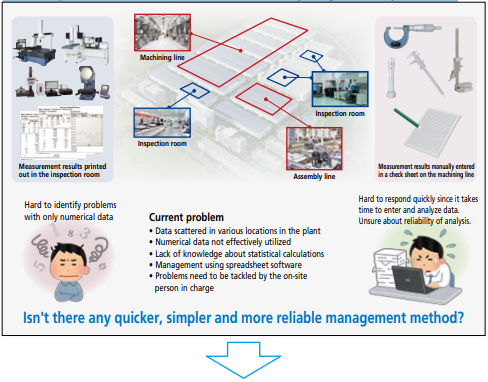

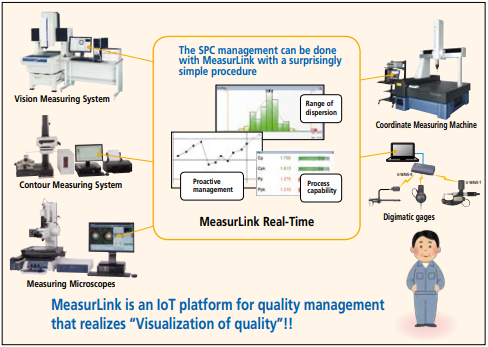
SPC management can be easily done by combining Mitutoyo measuring instruments and MeasurLink!!

MeasurLink supports anything from small scale, standalone systems to large-scale systems utilizing a PC network environment. Expansion from a standalone installation to a networked system can easily be performed, allowing a gradual upgrade from a single-test operation in one section to a full-scale operation.


MeasurLink Data Collection / Analysis Software
Real-Time Standard (RT Std)
Real-Time Professional (RT Pro)
Real-Time Professional 3D (RT Pro 3D)
MeasurLink Real-time is the Statistical Process Control (SPC) MeasurLink module that collects data from Mitutoyo and third-party measuring devices and systems to provide analysis functionality in real-time by displaying control charts or process capability indexes. Three versions are offered so that a customer can choose the version that best suits the requirements, from a standard version providing basic functionality through to the full-spec version offering data handling using Hoops 3D graphics.
MeasurLink Real-Time common functions
- Connectable measuring instrumentsnMeasuring tool with Digimatic output (equipped with PC data processing unit) [Supported interfaces]
Wireless (USB) U-WAVE (VCP)
Wired (USB) IT-016/USB-ITN VCP or HID
Wireless (D-sub 9 pin) IT-007R、MUX-10F,
DP-1VA LOGGER, and others - Screen display mode when collecting data
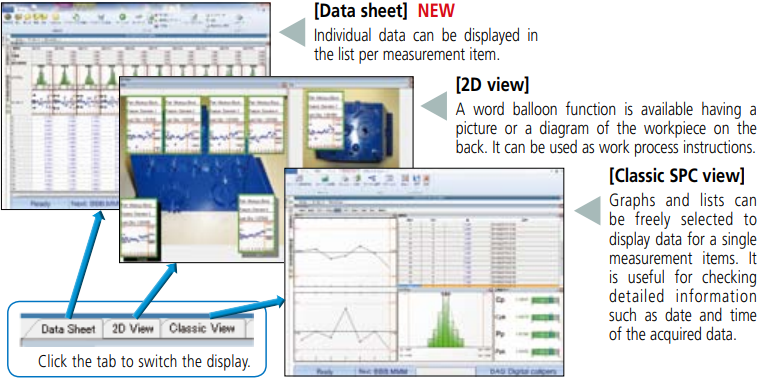
· Classic SPC view
· Data sheet
· 2D view
· Parts data sheet, etc. - Statistical Analysis result
[Chart]
Xbar-R, Xbar-S, X-Rs control charts, Histogram, Run chart,
Pre-control chart, Tear chart, Meta chart, Indicator bar,
multivariate data control chart, etc.
[Statistics]
Maximum value, Minimum value, Standard deviation,
Average ±3/4/6, Process capability indexes (Cp, Cpk, Pp,
Ppk), Defect ratio - Alarm function
[Target items]
· Out of tolerance
· 1 point exceeds control limit line (following are related to management chart)
· Consecutive 9 points on one side of center line
· 6 points successively increasing or decreasing Others including 8 judgment criteria for Shewhart control chart - Adding traceability information
· Measurement date (automatically added)
· Serial No. (Keyboard entry)
· Special causes and remedies
· Selection from comment list registered as an option
· Enter from keyboard when measuring classified title registered as an option (e.g. Lot No. LOT 001) - Report print out function
· Measurement values, analysis calculation results and various charts can be arranged to output according to requirements. - Export function of measuring result
· Excel format
· CSV format - Security function
· Once the access authorization is set, it requires “User name” and “Password” input before the program will
start. Data editing actions such as reference, entry and changes require authorization according to the user’s
role in order to preserve data reliability. - Operation languages 14 languages are supported:
· Japanese, English, French, German, Dutch, Spanish, Swedish, Polish, Italian, Turkish, Korean,Chinese (simplified characters), Finnish, Portuguese
Various data views
The measurement results are displayed in various views, including statistical analysis results, data lists, and work process imaging. The display can be switched instantly according to the needs of the operator.

- Adding traceability information
Traceability information for each workpiece can be added, for example, serial no., lot no., inspector name, machine no., or cause of problems and remedies.
This information can be used as search criteria when extracting data using the filtering function (RT Pro / RT Pro 3D) when a problem occurs.
- Alarm function
The operator is notified when an “Out of Tolerance” or “Out of Control Limit” situation occurs.
The method of notification can be selected from a pop-up window, e-mail (Fig. 1), or log file recording.
- Exporting data to an Excel file
Measurement data can be exported to an Excel file. This function is useful if the data needs to be used in a department that does not have MeasurLink.
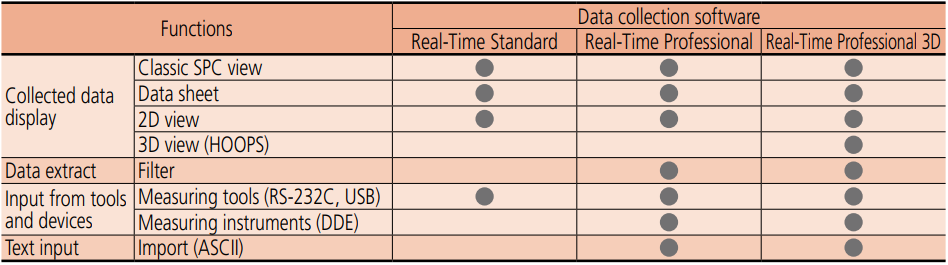
Table 1 : Data collection/analysis software Real-Time functional comparison

Real-time Professional 3D is a full-spec package. The feature to be measured can be displayed in detail using 3D CAD data.
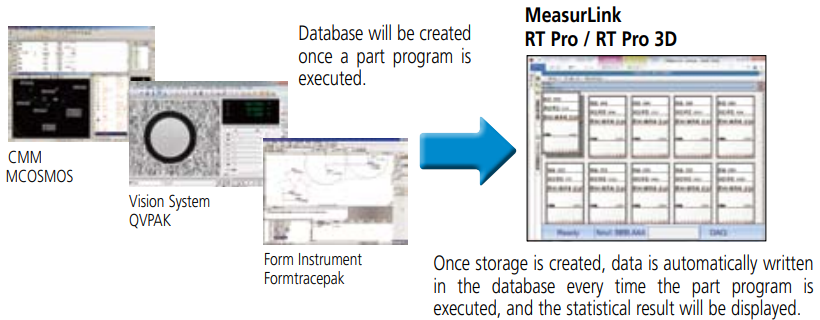
- Automatic linking with part programs
Linking with part programs created in CMM or Vision Measuring Systems, data such as part no.; measurement item; nominal size; tolerance value and more can be loaded from a part program. A database to store all of the data is automatically configured when a part program is run.

- Filtering function
Required data can be easily extracted based on the date and time of the measurement, added comments, or alarms.
- Import function
Measurement data saved in ASCII files can be loaded. Also, a feature to customize a template for loading according to the format is provided.
- Real-time Professional 3D is a full-spec package
The feature to be measured can be displayed in detail using 3D CAD data
3D view :-
3D graphics library HOOPS displays real view of the workpiece using an hsf file created from 3D CAD data. The displayed workpiece image can be freely turned, translated, or scaled so that you can get a clear view of the feature to be measured
The word balloons and lead lines that display the measurement result and measured feature will move following the CAD data translation
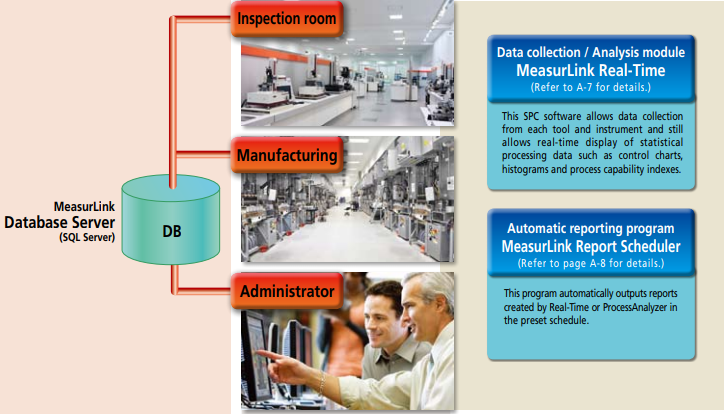
MeasurLink Automatic Report Generation Program
MeasurLink Report Scheduler
Automatically generates a report created by the Real-Time (Standard, Professional or Professional 3D) or Process Analyzer (Lite or Professional) modules, each of which is connected to the network according to a specified schedule.
The Use of MeasurLink Report Scheduler
Examples of use
- Automatic generation of a weekly report specified from among last week’s data.
- Automatic report generation by extracting only data with tag information about “tool replacement” (due to wear, breakage, etc.)
- Automatic generation of a daily report for each shift by filtering inspection record data
on the basis of a shift
MeasurLink Report Scheduler common functions
Report output destinations :- Printer, file, E-mail (as an attached document)
MeasurLink common functions
- Operating environments
[Operating System]
Microsoft Windows7 (32bit/64bit)
Microsoft Windows 8.1 (32bit/64bit)
(Microsoft Windows 8.1 RT is not supported)
Windows 10 (32bit/64bit)
(Windows 10 Mobile and IoT editions are not supported) - [Data base]
Microsoft SQL Server 2014 Standard Edition
Microsoft SQL Server 2014 Business Intelligence Edition
Microsoft SQL Server 2014 Enterprise Edition
Microsoft SQL Server 2012 Standard Edition
Microsoft SQL Server 2012 Business Intelligence Edition
Microsoft SQL Server 2012 Enterprise Edition
Microsoft SQL Server 2008 Standard Edition
Microsoft SQL Server 2008 Enterprise Edition
Standard / Workgroup Edition
RT Pro/Pro 3D Common functions
- Connectable measuring instrument
Mitutoyo Measurement Data Management System (equipped with PC data processing unit)
[Supported data processing software]
CMM: MCOSMOS V3.2 or later Vision System:QVPAK V10.0 or later/QSPAK V10.2 or later/ QSPAK MSE V3.1 or later/QIPAK V4.1 or later
· Vision unit: QSPAK VUE V4.1 or later
· Surface Roughness / contour instruments: Formtracepak V5.3 or later
· Roundness instruments: ROUNDPAK V5.6 or later
· Hardness testing machines: AVPAK V2.0 or later - Filter function Keyword items for data extraction
· Measurement data (year, month, day, time, week, etc.)
· Serial No.
· Traceability information (e.g. Inspectors, Machine No., etc.)
· Alarm item - Import function for text data
· Default format files (mbf, dfq, etc.)
· Customize function
A template can be created according the ASCII file to be imported.
RT Pro 3D Common functions
- Screen display mode when collecting data
- 3D view
MeasurLink Optional Process Analysis Software for Administrators
Process Analyzer Lite (PA Lite)
Process Analyzer Professional (PA Pro)
Process Analyzer is an optional software package provided for administrators who are authorized to access the database storing measurement data collected by MeasurLink Realtime for the purpose of checking and analyzing measurement results. Two types of packages are made available: Process Analyzer Lite, the basic version; and the full-spec Process Analyzer Professional version.
- PA Lite is a cost-effective package for viewing the measurement database.
Data stored in the MeasurLink database can be checked from a selected list.
The same data displayable by data collection software can be displayed, including measurement results, charts,
and statistical calculation results with the look and feel of Windows Explorer.
- PA Pro is a full-spec package that provides additional data check and analysis capability.
Can also perform various analyses by filtering, data processing, etc., in addition to data checking.
- Filtering function that allows data extraction and grouping
Data can be extracted or grouped by selecting the date and time and other traceability information as keywords.
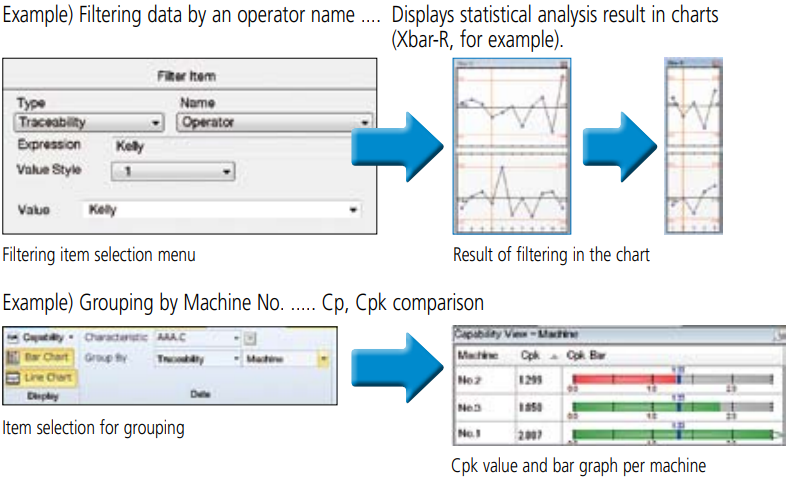

Table 1 Process Analyzer functional comparison (an option available for administrators)
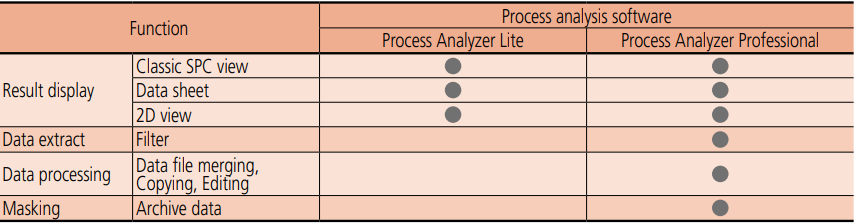

PA Lite/PA Pro common functions
- Result display
- Classic SPC view
- Data sheet
- 2D view
- Parts data sheet, etc.
- Statistical Analysis result [Chart] Xbar-R, Xbar-S, X-Rs control charts, Histogram, Run chart, Pre-control chart, Tear chart, Meta chart, Indicator bar, multivariate data control chart, etc.
[Statistics]
Maximum value, Minimum value, Standard deviation, Average ±3/4/6, Process capability indexes (Cp, Cpk, Pp, Ppk), Defect ratio - Report print out function
- Measurement values, analysis calculation results and various charts can be arranged to output according to
requirements. - Exporting function of measurement result
- Excel format
- CSV format
PA Pro functions
- Statistical analysis result
[Chart]
Scatter plots: The relationship between two items can be plotted. - Data processing capability Files can be managed by merging, copying, and editing. Also, the data archive function allows inclusion of the archived data in the Real-Time list.
- Data processing
- Data file merging,Copying
- Editing
- Data processing capability
- Old data can be displayed extracting from the list of the data collection software.
- Electronic certification function Conforms to FDA 21CFR PART11
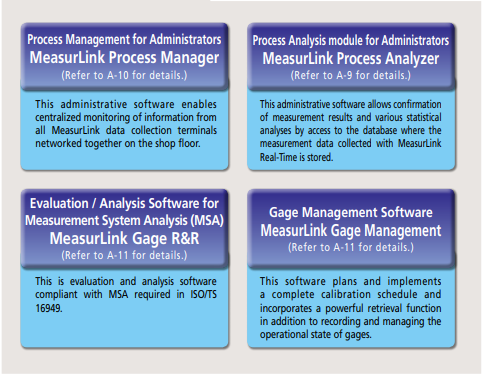
MeasurLink Process Management for Administrators
- Process Manager
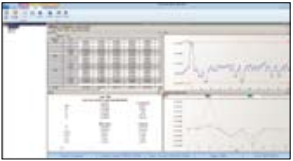
MeasurLink Process Manager enables centralized monitoring of real-time measurement information and checking of detailed information from all MeasurLink data collection terminals networked together on the shop floor. Measurement results can be checked in real-time to enable minimizing defects without visiting the shop floor. In addition to simple GO/NG judgments, use of tools such as Manager View, histograms, process capability indexes, etc., make it possible to find abnormal process trends easily.
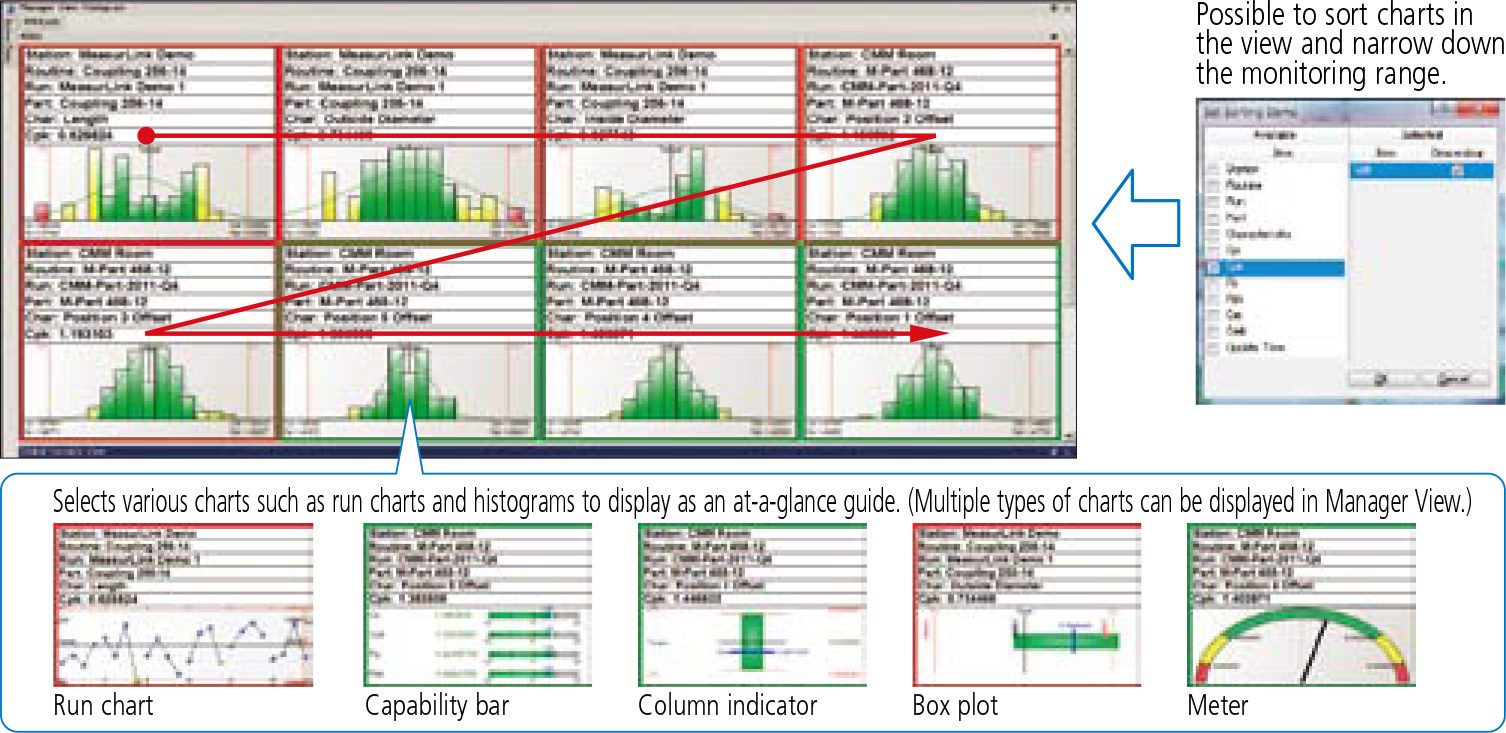
- Manager View
Displays various types of charts as an at-a-glance guide. The administrator can narrow down all items of data currently being measured into a specific monitoring range of those of critical importance or sort those data (in ascending or descending order) on the basis of process capability index.

- Global measurement value view
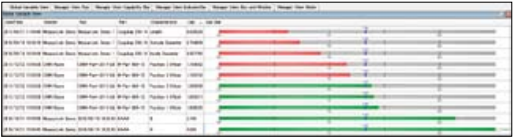
good or bad process capability indexes at a glance. This allows the administrator to sort all current measurement data (in ascending or descending order) on the basis of process capability index, measurement date and time, part name, etc.

- Log view
Displays various types of events that occur during measurement. This allows the administrator to grasp the state of measurement operation (measurement start/termination, etc.) and the occurrence of an abnormal event (out-of-tolerance, etc.) for all current measurement data.
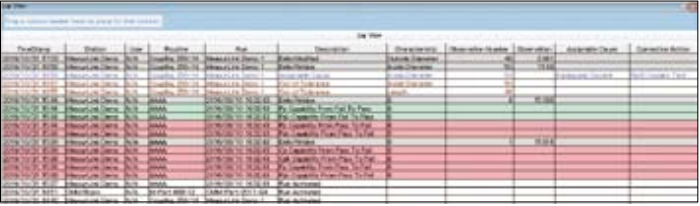

Events possible to be logged :-
- Measurement start/termination
- Recollection / change of measurement data
- Occurrence of outliers (Out-of-tolerance / out-of-control / run / trend, etc.)
- Out-of-recognition cause
- Change of process capability index (Acceptance to rejection / rejection to acceptance)
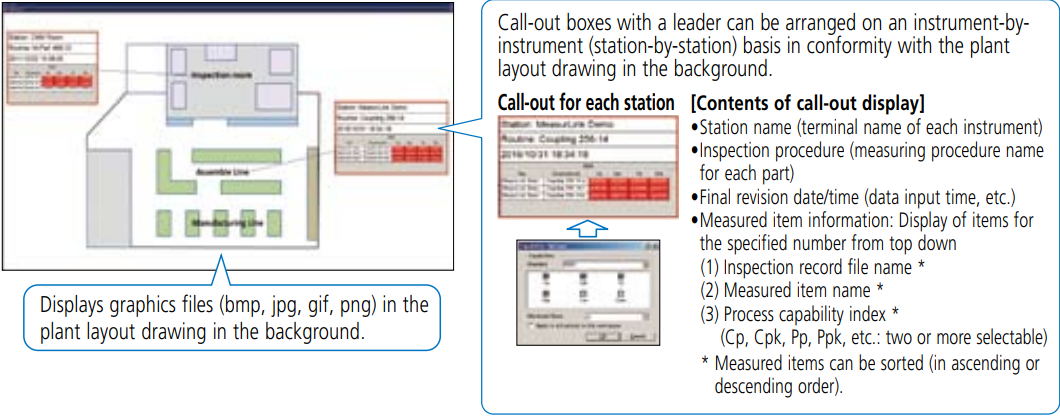
Plant view
Displays a process capability index for each measuring instrument on the plant layout drawing. This allows the administrator to quickly identify the location where an abnormality has occurred.

Loggable event
- Start and end of measurement
- Recollection/change of measurement data
- Irregular value occurrence (Out of tolerance, out of management, sequence, tendency, etc.)
- Unmissable causes
- Change of process capability index (Acceptance to rejection / Rejection to acceptance) Contents of call-out display
- Station name (terminal name of each measuring instrument)
- Inspection procedure (measuring procedure name for each part)
- Final revision date/time (data input time, etc.)
- Measured item information: Displays the designated number of items from the top
(1) Inspection record file name*
(2) Measurement item*
(3) Process capability index*
(Cp, Cpk, Pp, Ppk, etc., multiple selection available)
*Measurement items are sortable (ascending, descending order)
MeasurLink Evaluation / Analysis Software for Measurement System Analysis (MSA)
This is evaluation and analysis software conforming to Measurement System Analysis (MSA) required in ISO/TS 16949. Implementing MSA evaluation can be performed easily and quickly. ISO/TS 16949 requires that a proper measurement system be achieved by analyzing the accuracy of each instrument and variations in operator effects on repeatability using statistical methods.
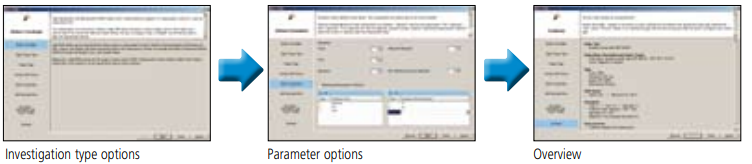
- Automatic calculation of MSA evaluation results
This allows the operator to simply input an evaluation method/evaluation condition and measurement data with the Wizard function. The operator can implement MSA evaluation simply by selecting an “investigation type option”, “gage option”, “data input source option”, “parameter option”, etc. Measurement results, charts, and statistical calculation results are presented with the look and feel of Windows Explorer.

• Evaluation method compliant with MSA (fourth edition)
The software can implement evaluation using the following methods compliant with MSA (Measurement System Analysis).
- Measurement value tolerance gage R&R variance analysis method
- Measurement value tolerance gage R&R range&average method
- Measurement value branching gage R&R variance analysis method
- Measurement value branching gage R&R average&range method
- Measurement value range method
- Measurement value simplified method
- Measurement value MSA4
- Deviation
- Linearity
- Stability
Analysis chart view

Registration of gage-specific information
- Registration of information on gages within the system :-
This allows registration of gage information on the following items and association with evaluated results. Registration items: Gage name, maker, model, resolution, unit, measuring range, etc. - Information link between MeasurLink Gage Management and this software :-
This software can use gage information that has been registered in Gage Management directly as options.
Additionally, since R&R evaluation results are also linked with gage information, the schedule of gage R&R expiry dates can be managed by Gage Management.
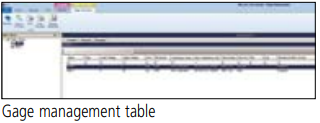
MeasurLink Gage Management Software
Gage Management
This software can plan and implement a reliable calibration schedule with a powerful retrieval function in addition to recording and controlling the status of gages. It enables simple recording of gage usage state (operation, storage, calibration, gage R&R, repair and out-of-service) to speedily understand the current location and state of all gages. Common gage information can be viewed from all networked terminals in which this network-compatible software has been installed. Gage information can be shared between software packages linked to MeasurLink Gage R&R.
Creation of a list of calibration-targeted gages from the gage administration table

Registration and running a calibration procedure
Allows simple registration of the calibration procedure for each gage and implementation of the calibration.
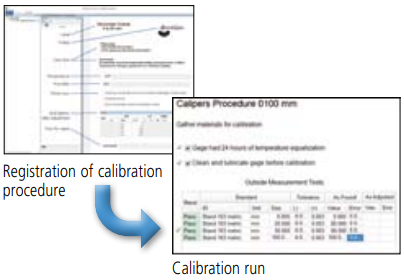

Confirmation of detailed gage information
Allows confirmation of detailed information on individual gages. The software allows you to display a list of gages depending on “Calibration Overdue”, “Next Month Due”, etc., by setting a calibration date and confirm detailed information on the calibration history of gages.